
Smarter Warehouses, Smarter Decisions: How AI Optimizes Distribution Center Networks 🏭🤖
- Javier Barrios

- Feb 20
- 5 min read
Updated: Feb 25


Hi, I’m Javier Barrios. I’m passionate about supply chain and manufacturing, and I’ve spent years partnering with finance, strategy, and operations leaders to drive smarter decisions that fuel growth, reduce costs, and empower teams.
One area I’m especially interested in is distribution center network design, and how the right data can unlock better outcomes. Take a look at how AI can help optimize distribution networks, uncover smarter scenarios, and support confident, high-impact decisions.


🤖 Why Does AI Matter in Supply Chain Network Design?
Because distribution decisions involve millions of dollars, long-term capital commitments, and complex trade-offs between cost, service, and risk.
AI empowers leaders to explore more scenarios, uncover hidden cost drivers, stress-test assumptions, and turn complex calculations into clear, actionable business insights, far faster than spreadsheets alone.
So here’s the real question:
Should your firm add another distribution center? Do you stay with one East Coast DC, or open a second on the West Coast?
We start by running the numbers in Excel: transport, facility, inventory, and service costs. Then AI steps in to challenge assumptions, suggest smarter alternatives, and explain the trade-offs in plain language.
Instead of guessing, you let AI guide the decision, and quickly see whether adding that second DC truly makes financial and operational sense.

What if one distribution decision could impact millions in cost and customer experience?
In this short video, we show how AI strengthens network design by evaluating service, cost, and trade-offs, enabling smarter analysis and more confident investment decisions.

Why Add AI to Distribution Center Network Design?
Traditional network design is an optimization problem, many variables, many trade-offs, and many possible scenarios. Excel helps you calculate outcomes. AI helps you explore, explain, and optimize faster.
Think of AI as:
A scenario generator
A decision explainer
A what-if accelerator
A business translator (turning math into insights)
You’ll still use Excel for calculations, but AI will guide what to test and why it matters.
Optimizing distribution center (DC) locations can:
Reduce total logistics costs by 10–30%
Improve delivery times by 15–40%
Significantly improve customer satisfaction
But the challenge is not calculation, it’s exploration.
“Which scenarios should we even test?”
This is where AI changes the game.
Modern supply chain design platforms (e.g., AnyLogistix, Coupa, LLamasoft) already embed AI and optimization engines. In this module, you’ll simulate that experience manually, while using AI to:
Propose scenarios
Explain trade-offs
Suggest improvements you might miss
Scenario Description
Fictional Company: AlphaCorp (national e-commerce retailer)
Current State:
One DC on the East Coast (New Jersey)
Decision Question: Should AlphaCorp add a second DC on the West Coast in Los Angeles, CA?
You’ll compare:
Scenario A: Single East Coast DC
Scenario B: East + West Coast DC
Note: This module demonstrates how AI can support DC network optimization in a simplified, 30-minute exercise. In real-world applications, significantly more effort is required, especially to collect accurate, complete data. AI can analyze quickly, but data integrity, validation, and scenario refinement are critical to producing trustworthy results and making confident execution decisions.
Step 1a: Assess DC Network Data
We’ll be using the free version of Microsoft Copilot for this exercise. If you’re new to Copilot, click below for a quick guide on how to access it and get started.
Assume the below sample data for four customer regions and associated costs.
Customer Region | Annual Demand | Distance to East DC (NJ) | Distance to West DC (LA) |
Boston (NE) | 1,000 | 300 miles | 2,970 miles |
Atlanta (SE) | 800 | 750 miles | 2,180 miles |
Denver (Central) | 600 | 1,770 miles | 830 miles |
Los Angeles (W) | 1,200 | 2,700 miles | 50 miles |
Cost & Service Assumptions
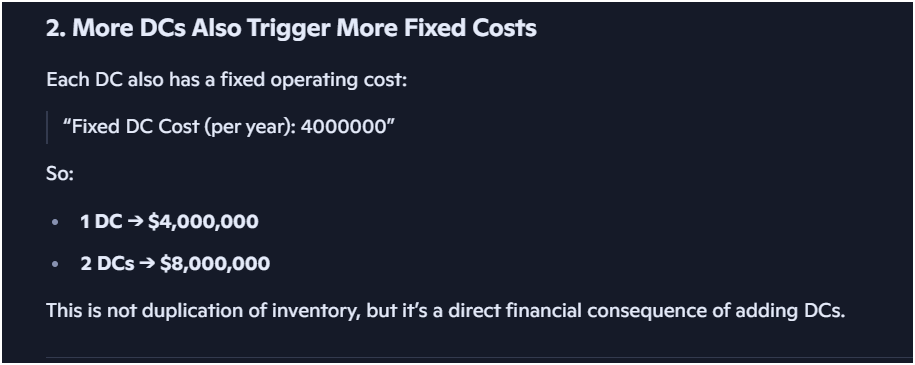
Fixed DC cost: $4,000,000 / year
Inventory cost: $300,000 / DC / year
Transport cost: $1 per unit per mile
Service target: 2-day delivery (~1,000 miles)
Late delivery penalty: $500 per unit
Either "cut and paste" the above sample data or upload the data in excel into Copilot.
Step 1b: Upload sample data
Click on the "+" plus button
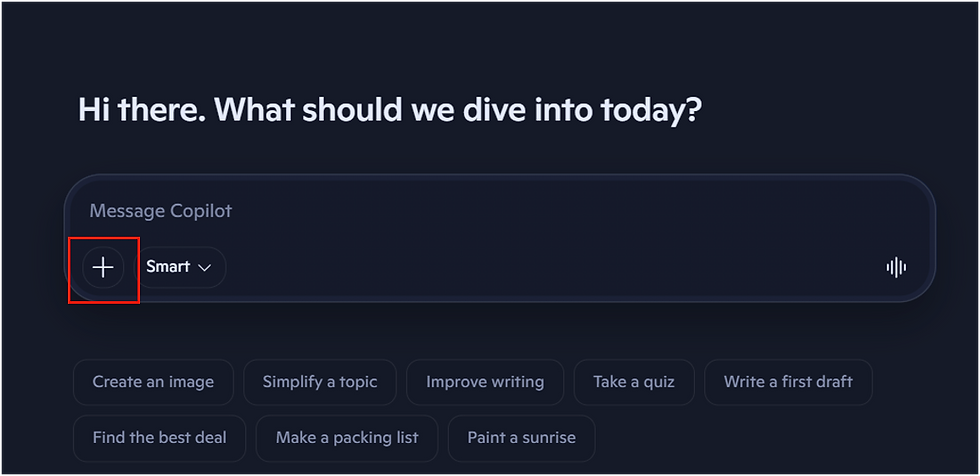
Click on the "Add images or files"

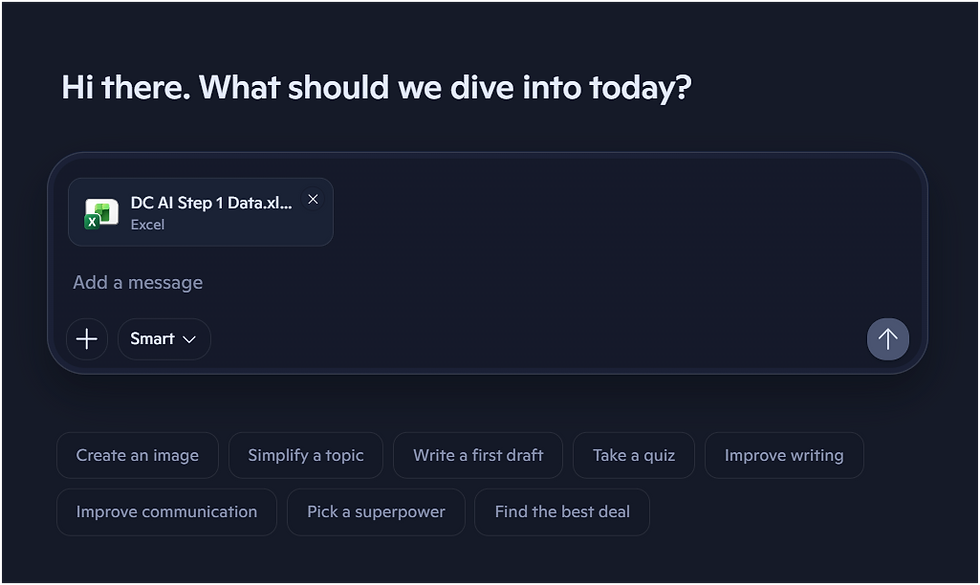
Find the "DC AI Step 1 Data" and upload. Once uploaded, the file while appear in Copilot
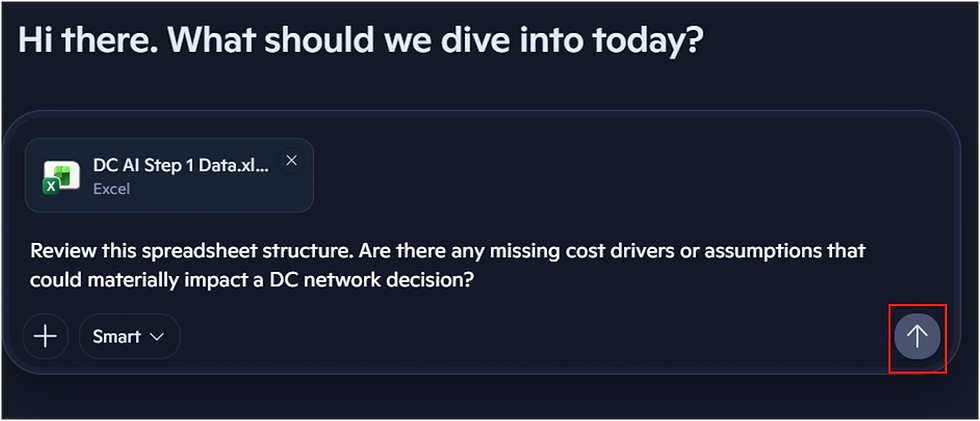
Step 1c: AI Assist Prompt
Type or "cut and paste" the following in Copilote:
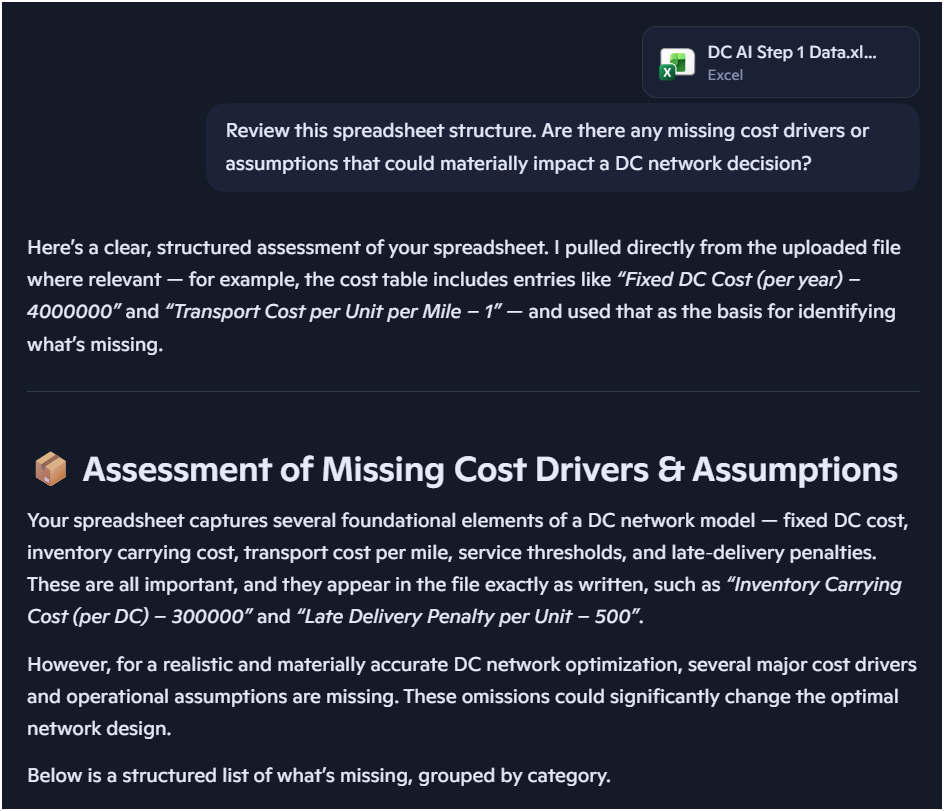
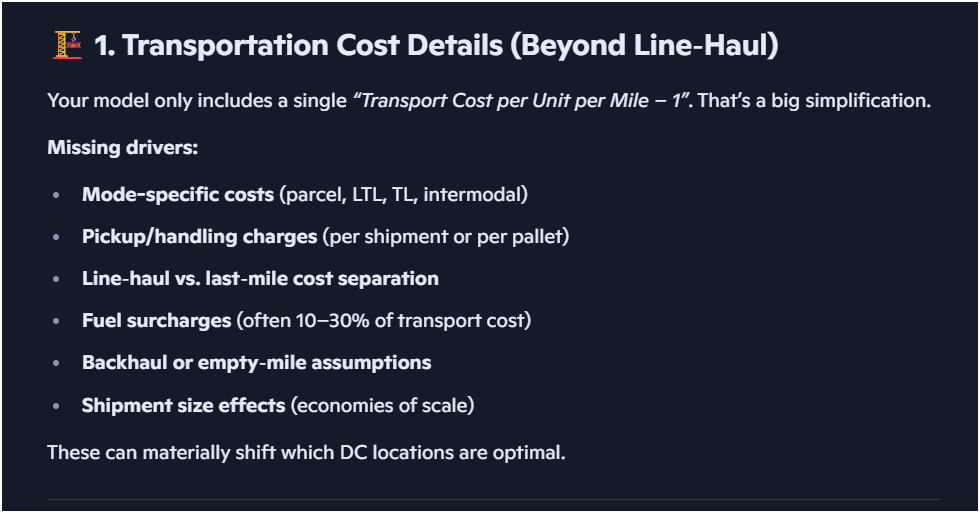
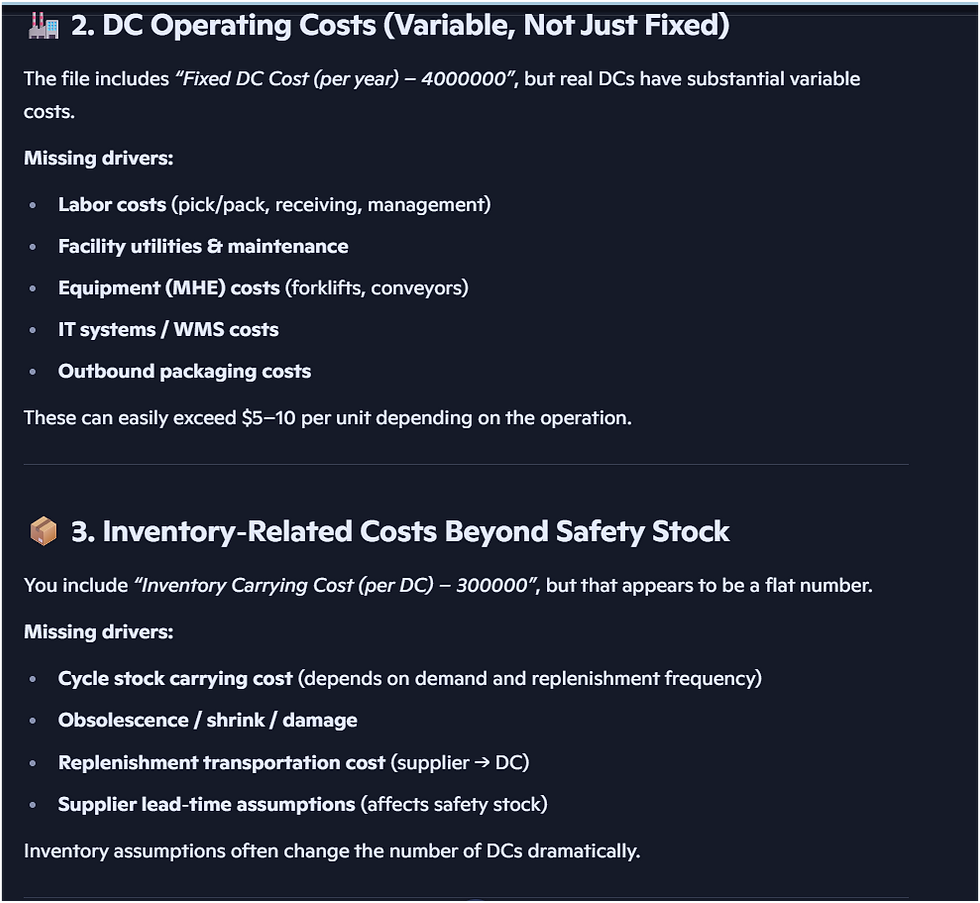
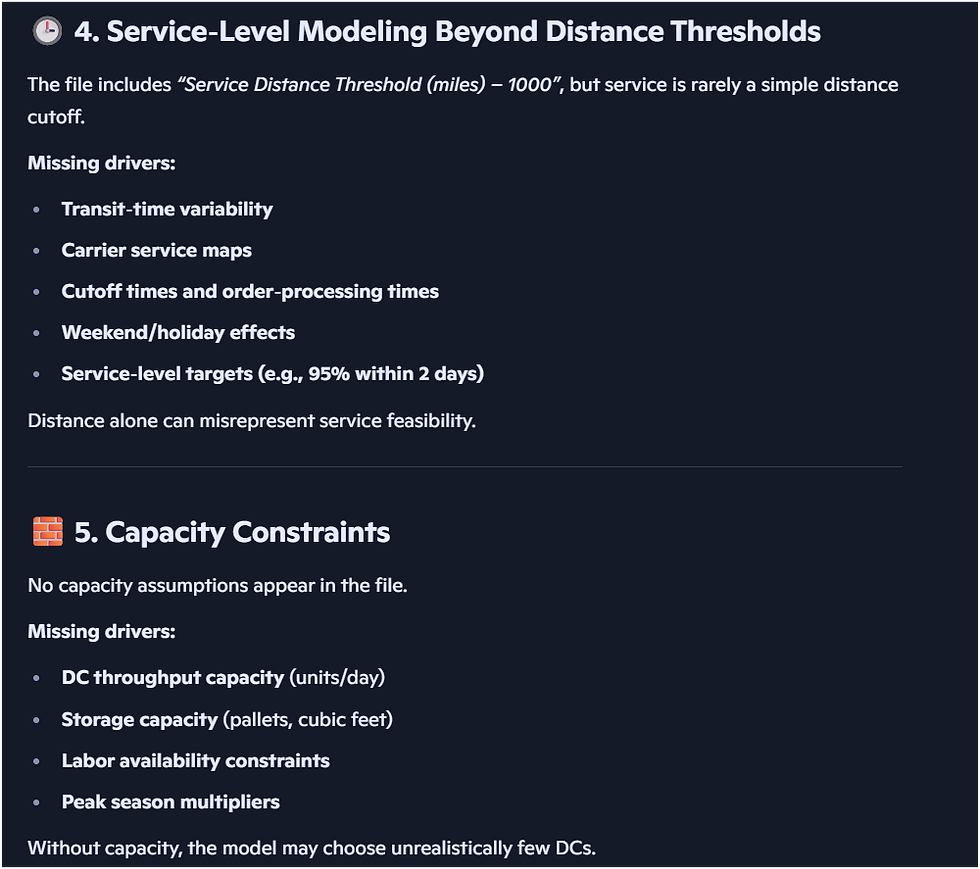
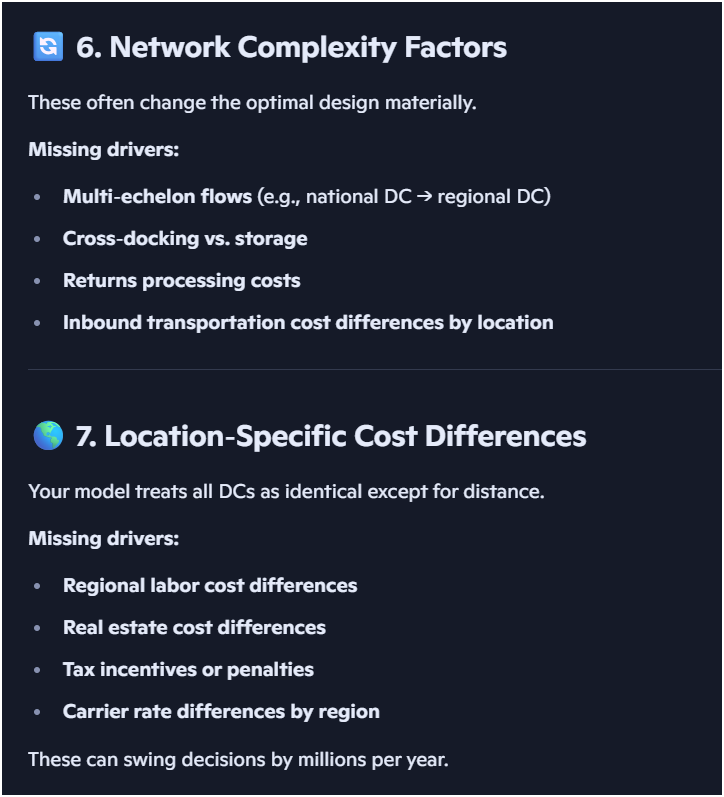
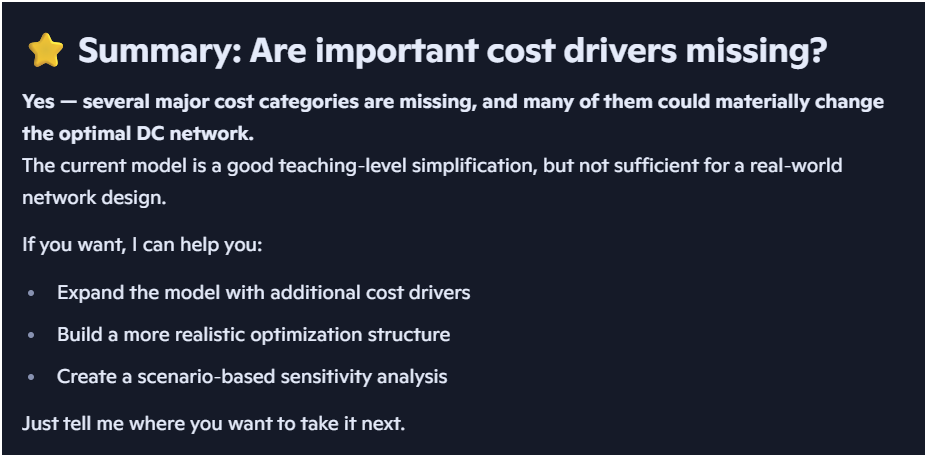
“Review this spreadsheet structure. Are there any missing cost drivers or assumptions that could materially impact a DC network decision?”

Click the "up arrow"
Copilot will now suggest additional data it believes you may need for the DC network assessment. Results can vary, and AI can be wrong, so review the recommendations and use your judgment to decide what’s truly relevant and viable.
Step 2: Transportation Cost Calculation
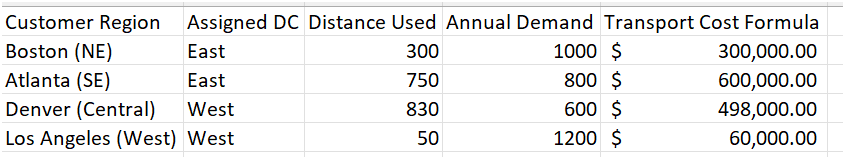
In Step 1, Copilot AI recommended adding transportation costs. Let's assume the following sample transportation data for the existing East DC and proposed West DC:
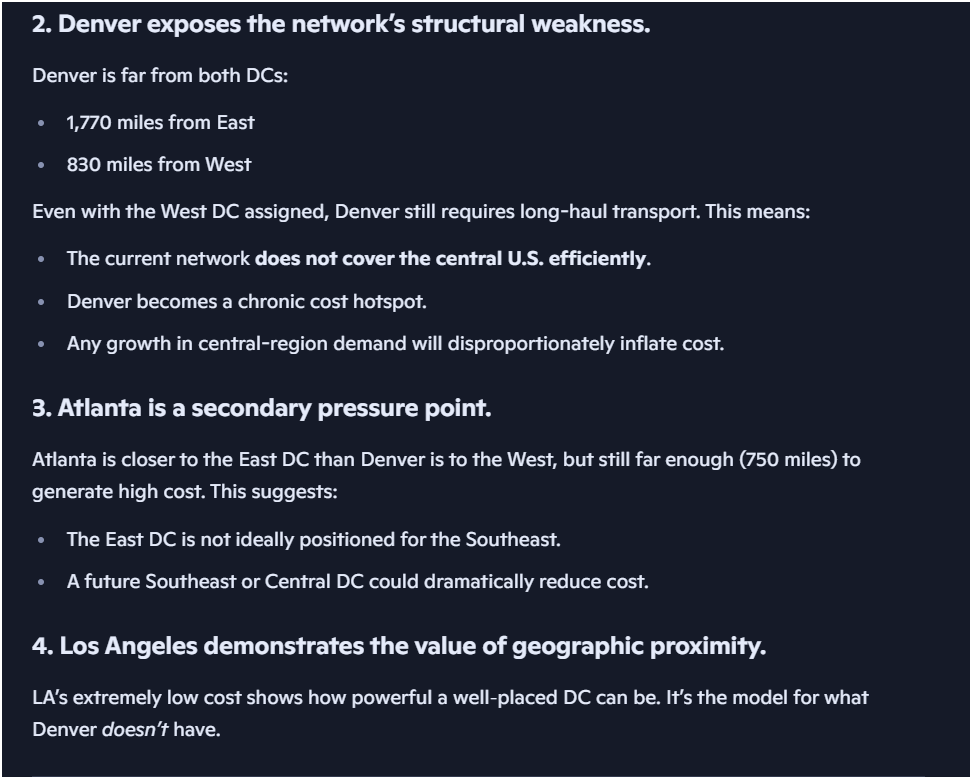
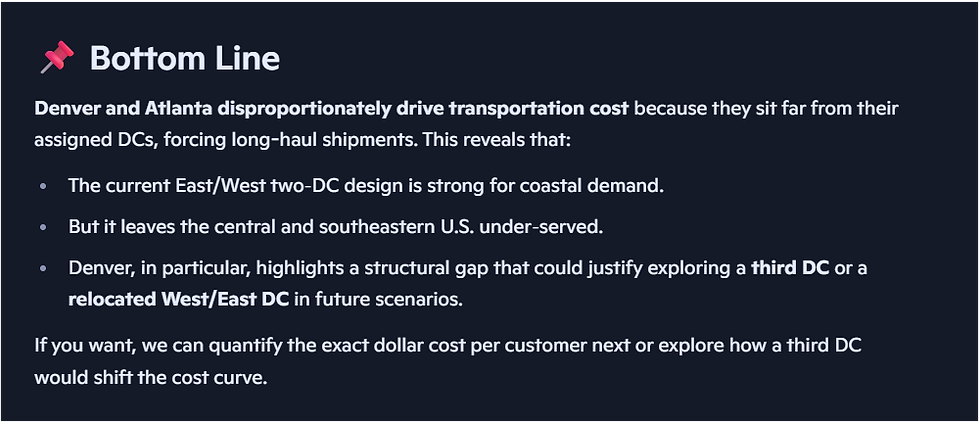
Step 2b: Transportation Cost Pressure Points, Exposed
Upload the data and ask Copilot:
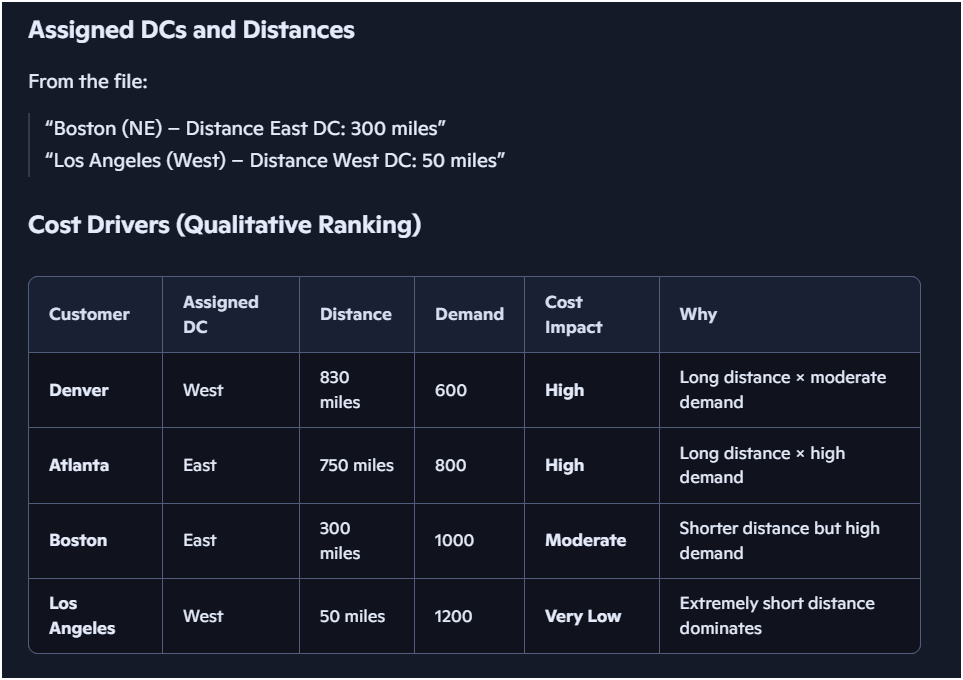
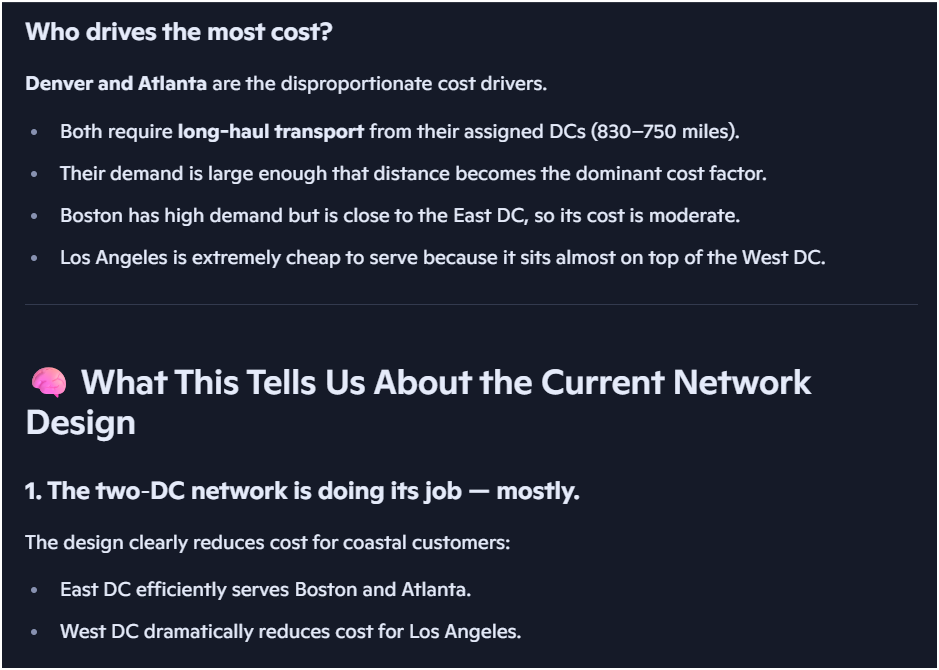
"Which customers disproportionately drive transportation cost, and what does that tell us about our current network design?"

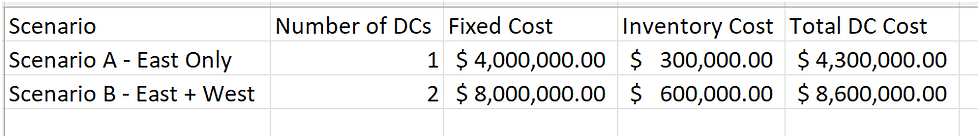
Step 3a: Fixed & Inventory Costs (Excel)
Another critical component in evaluating a DC network is understanding fixed operating expenses and inventory carrying costs.
For this exercise, assume the following additional data:
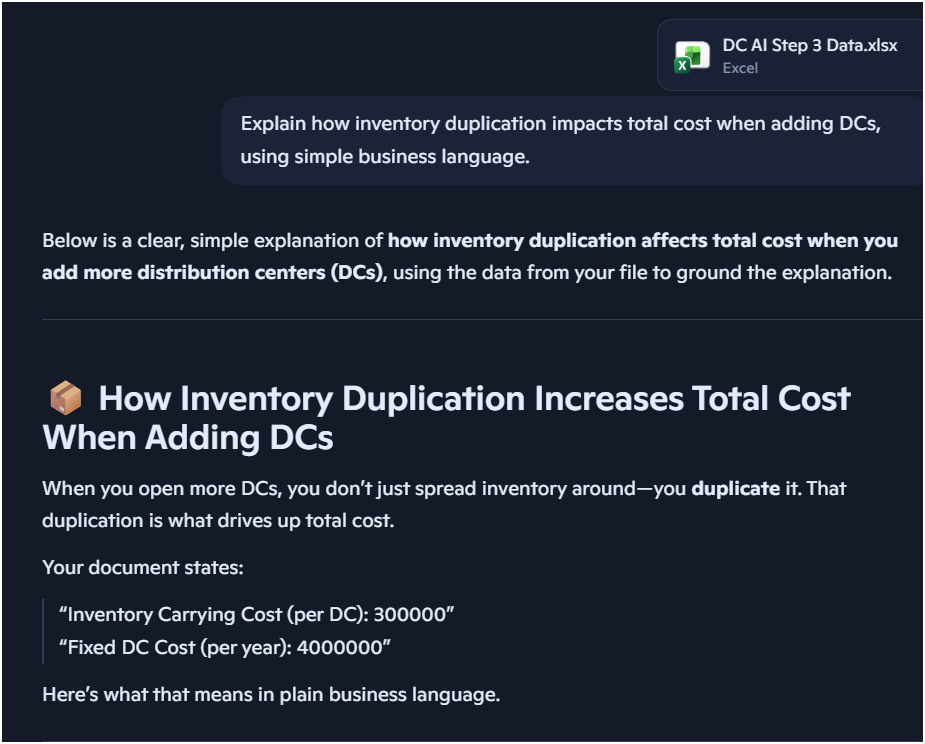
Step 3b: AI Assist Prompt
Upload the fixed and inventory data and ask Copilot:
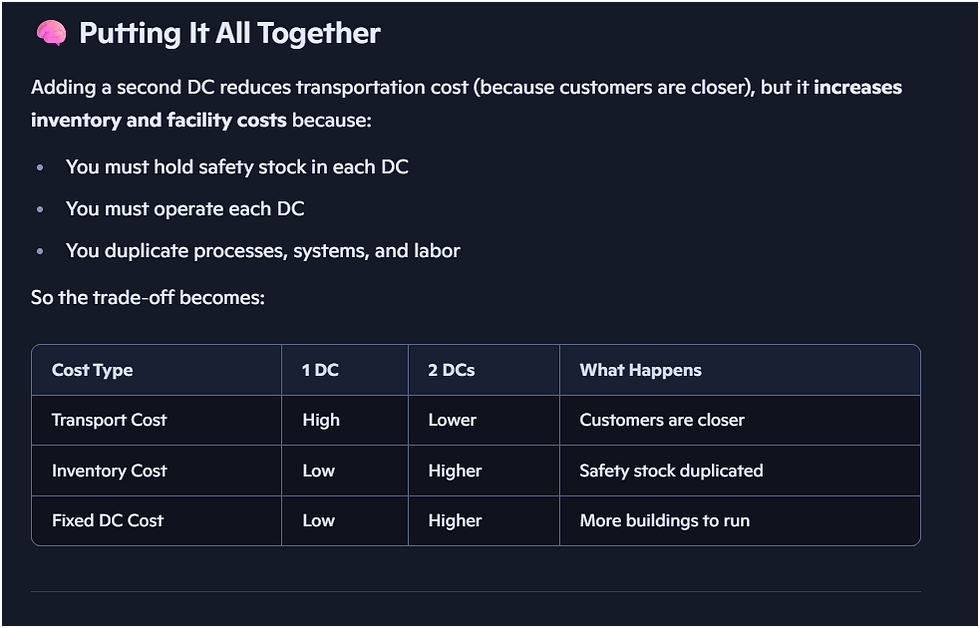
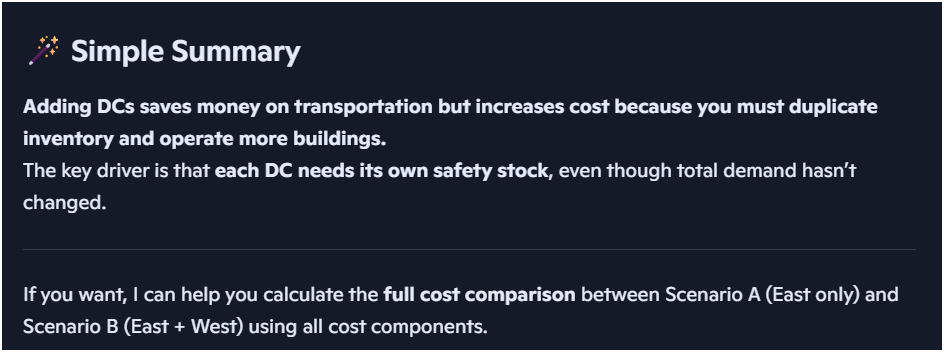
“Explain how inventory duplication impacts total cost when adding DCs, using simple business language.”

Step 4a: Cutomer Service Level Evaluation
Let's assess how distance and cost impact service levels by identifying which customers receive on-time deliveries and which do not. This turns logistics data into measurable performance, revealing revenue risk and competitive vulnerability, shifting focus from transportation cost to customer experience.
Assume the following data:
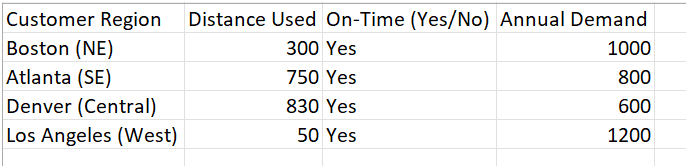
Step 4b: Customer Service Impact
Upload the above data and ask Copilot:
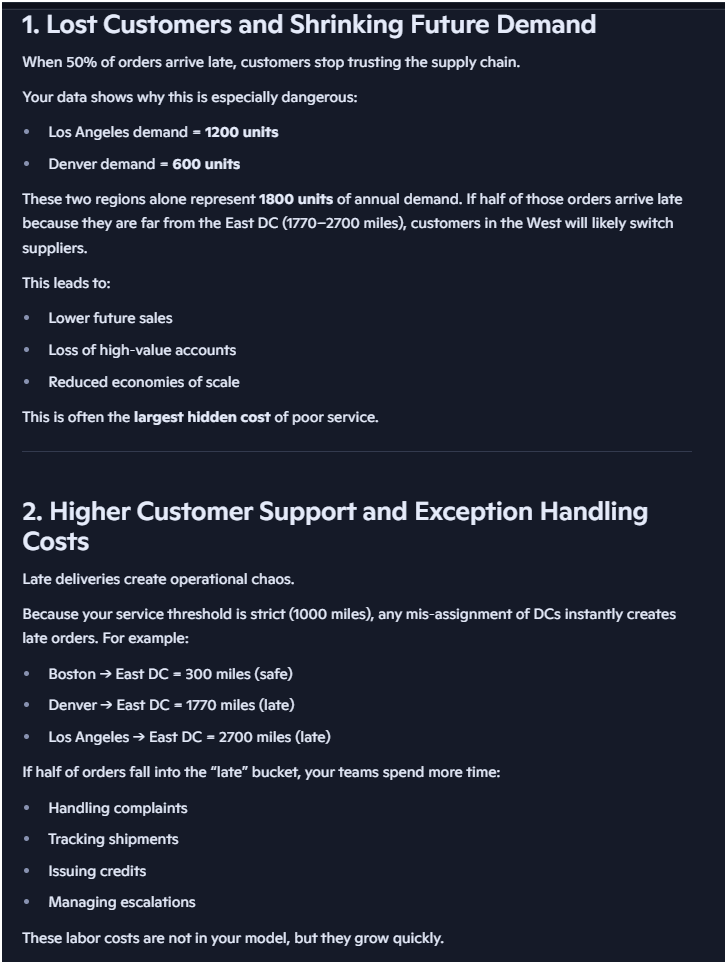
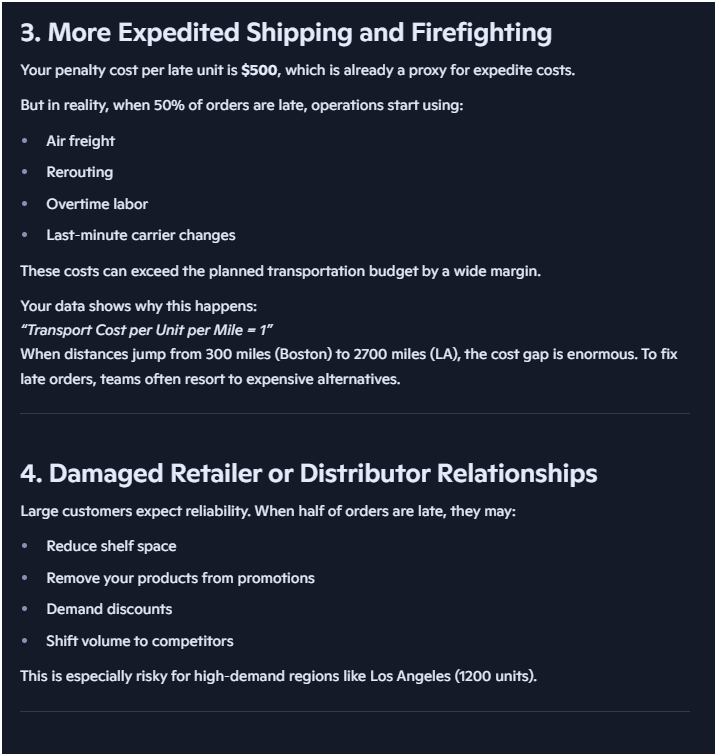
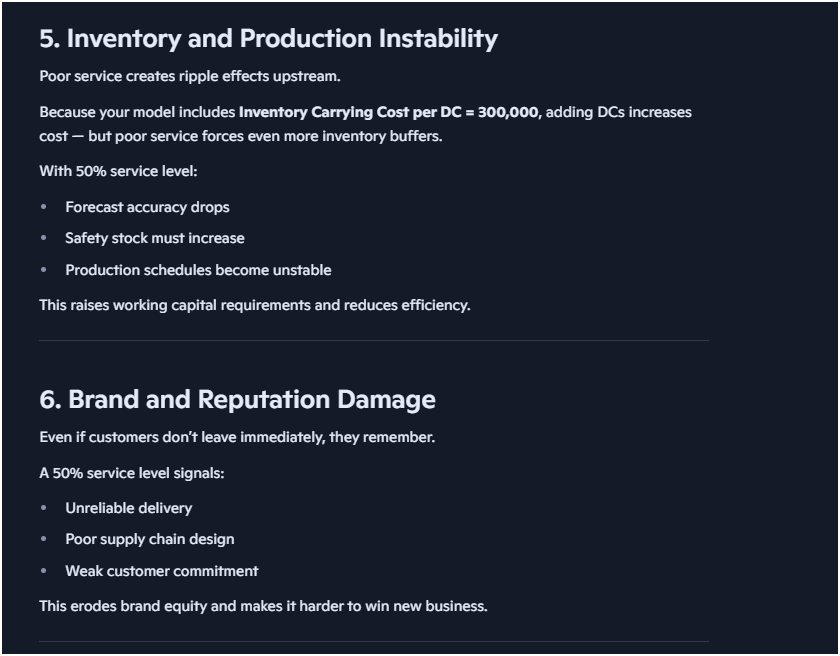
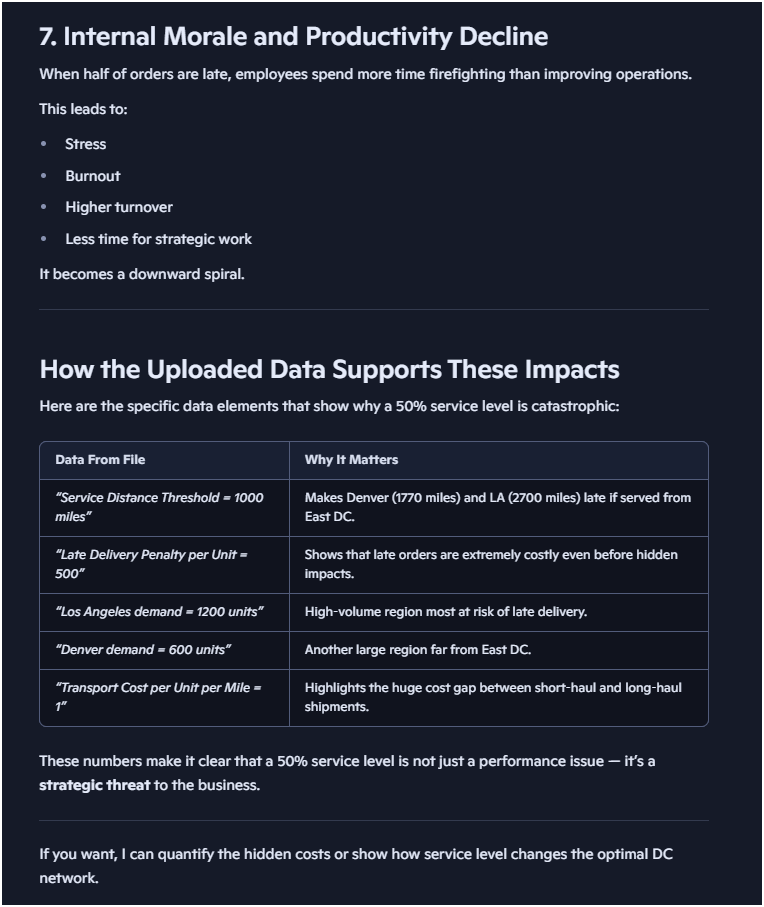
“Using the uploaded data, if service level drops from 100% to 50%, what real business impacts might this cause beyond penalty cost? Provide details on how the uploaded data is used.”

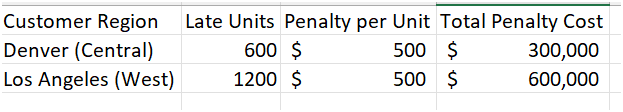
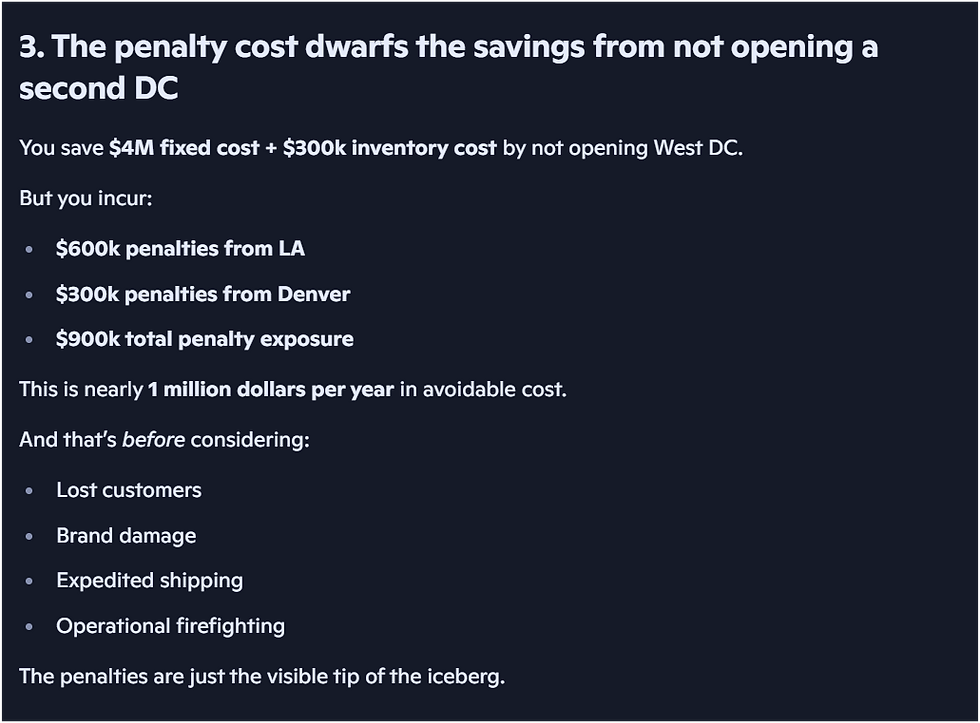
Step 5a: Penalty Cost Calculation Let’s understand how service failures translate into financial impact. This step exposes the true economic cost of poor performance and ensures network decisions reflect total business impact, not just transportation or facility expenses, aligning operational choices with customer satisfaction and long-term profitability.
Assume the following data:
Step 5b: AI Assist Prompt
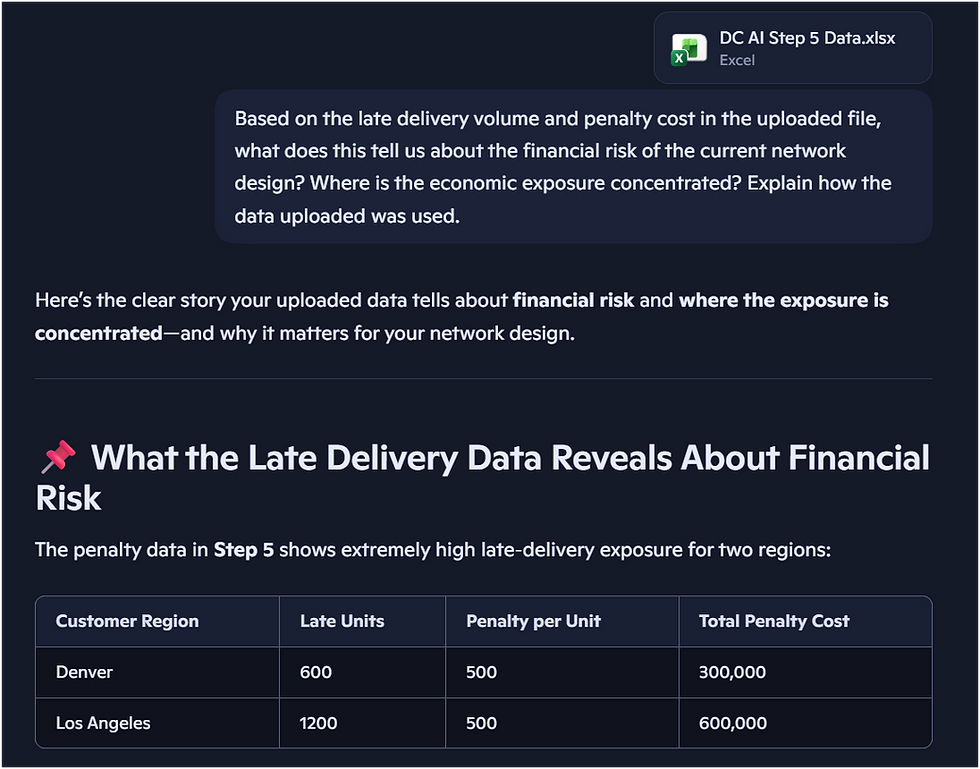
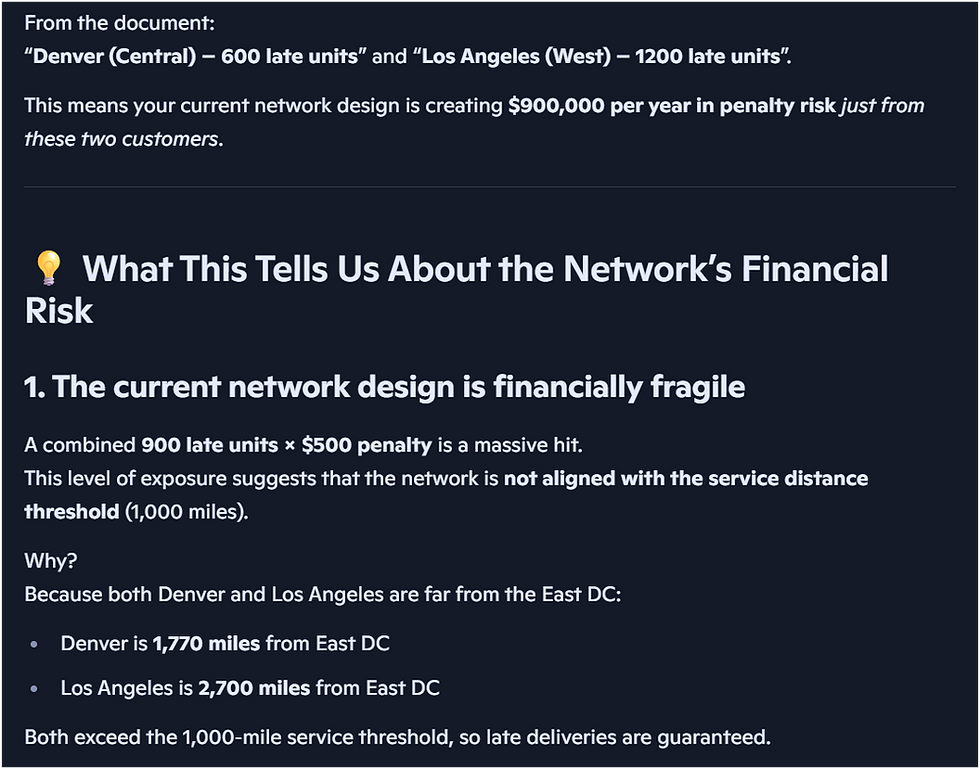
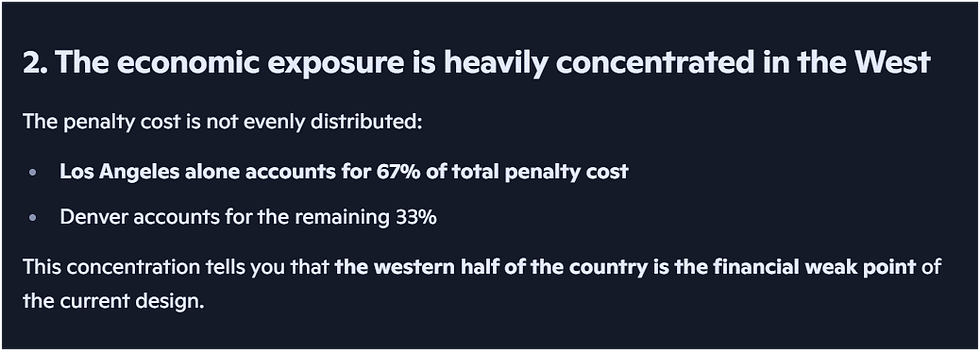
Upload the sample data and ask Copilot:
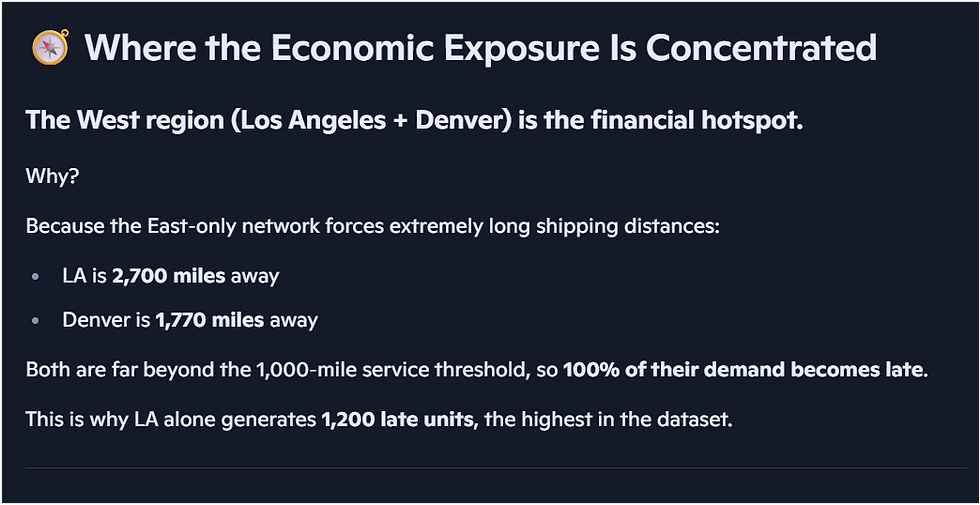
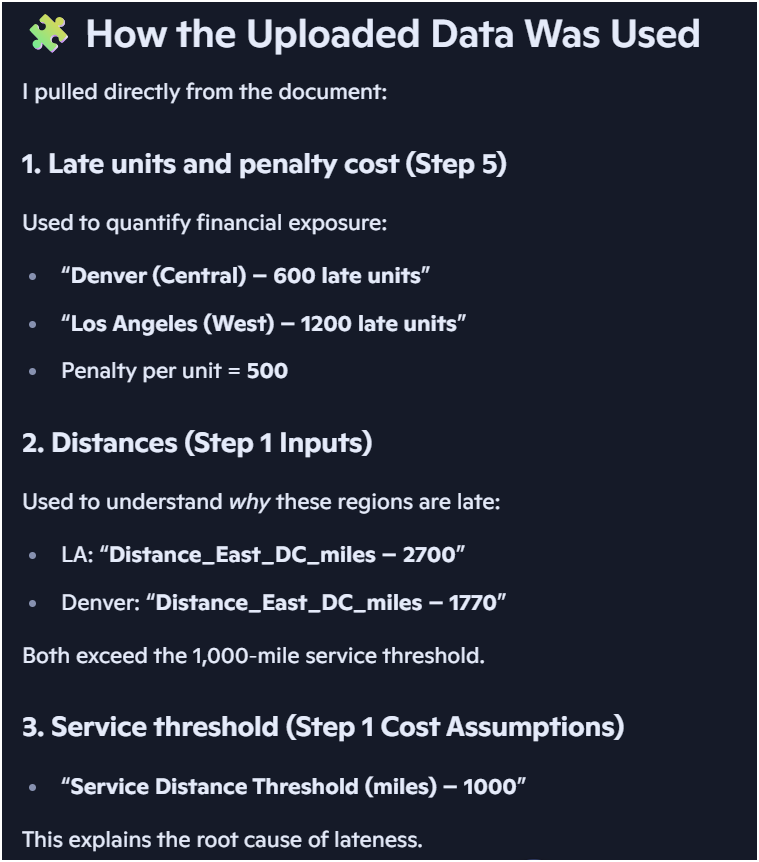
"Based on the late delivery volume and penalty cost in the uploaded file, what does this tell us about the financial risk of the current network design? Where is the economic exposure concentrated? Explain how the data uploaded was used."

Step 6a: AI-Enabled Scenario Planning
Let’s bring it all together into one clear comparison. By combining transportation, facility, inventory, and penalty costs, we reveal the true total cost of each network option. This holistic view enables stronger executive decisions, balancing efficiency, service performance, and long-term profitability.
Assume the following data:
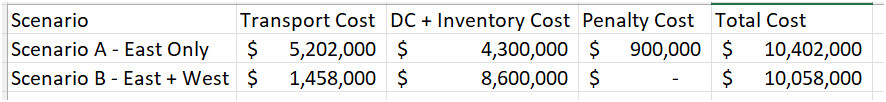
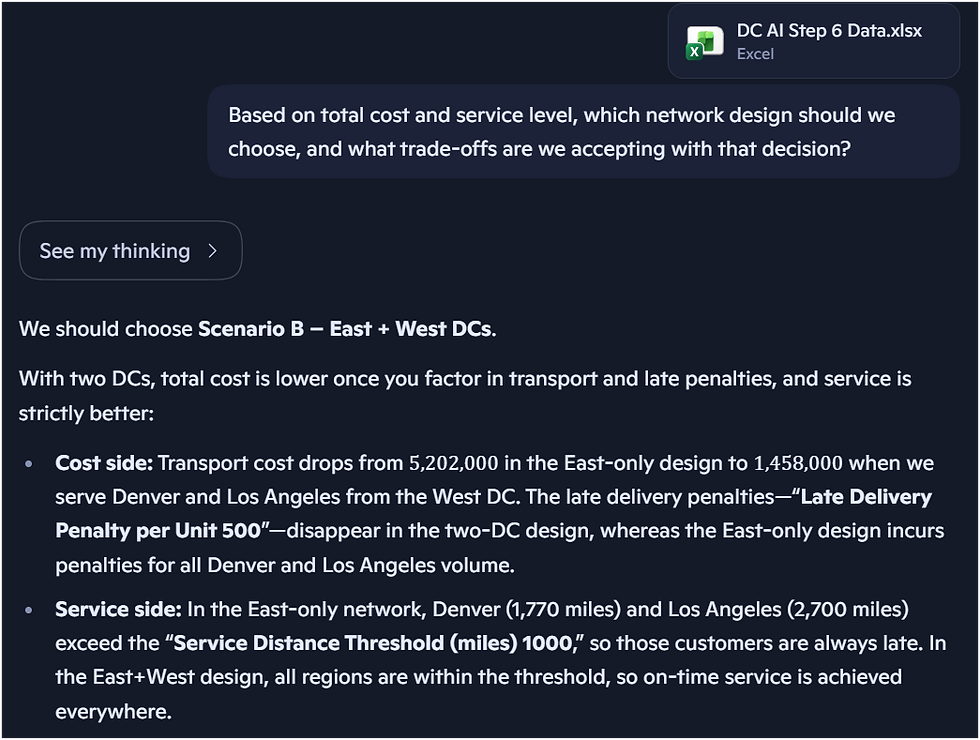
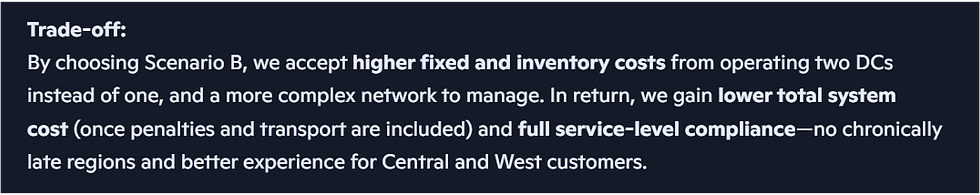
Step 6b: DC Network Recommendation
Upload the data and ask Copilot:
“Based on total cost and service level, which network design should we choose, and what trade-offs are we accepting with that decision?”
Step 7a: AI-Driven Scenario Expansion
Now let AI demonstrate its true power. Move beyond fixed scenarios and use AI to explore smarter alternatives. This step challenges assumptions, tests new configurations, and uncovers hidden opportunities, shifting the focus from simple comparison to strategic optimization of cost, service, resilience, and long-term competitive advantage.
We will use the same data from Step 6.
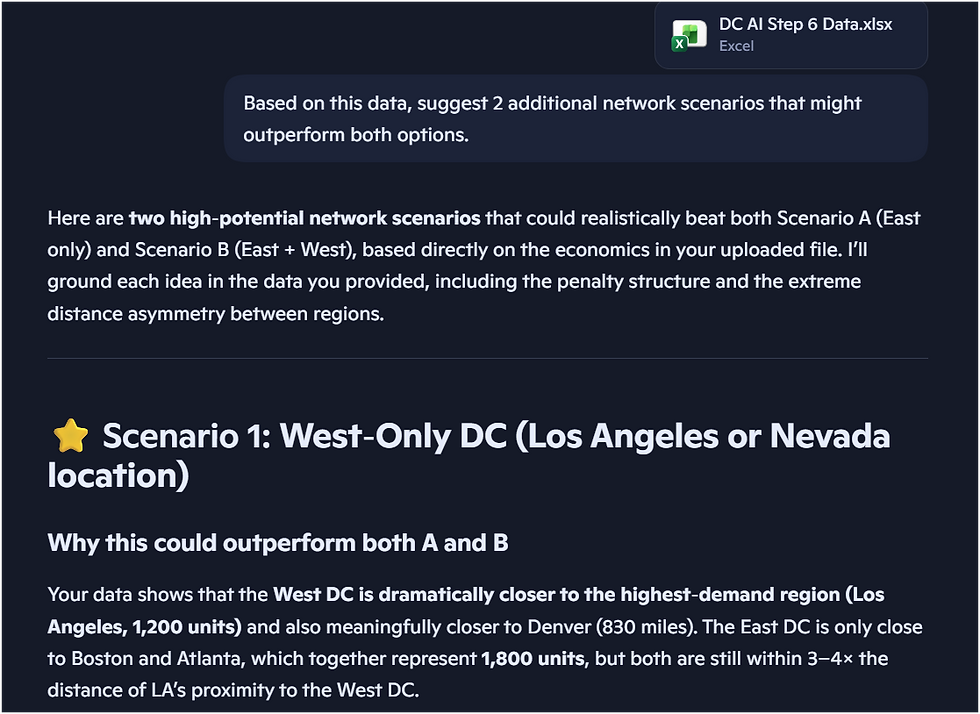
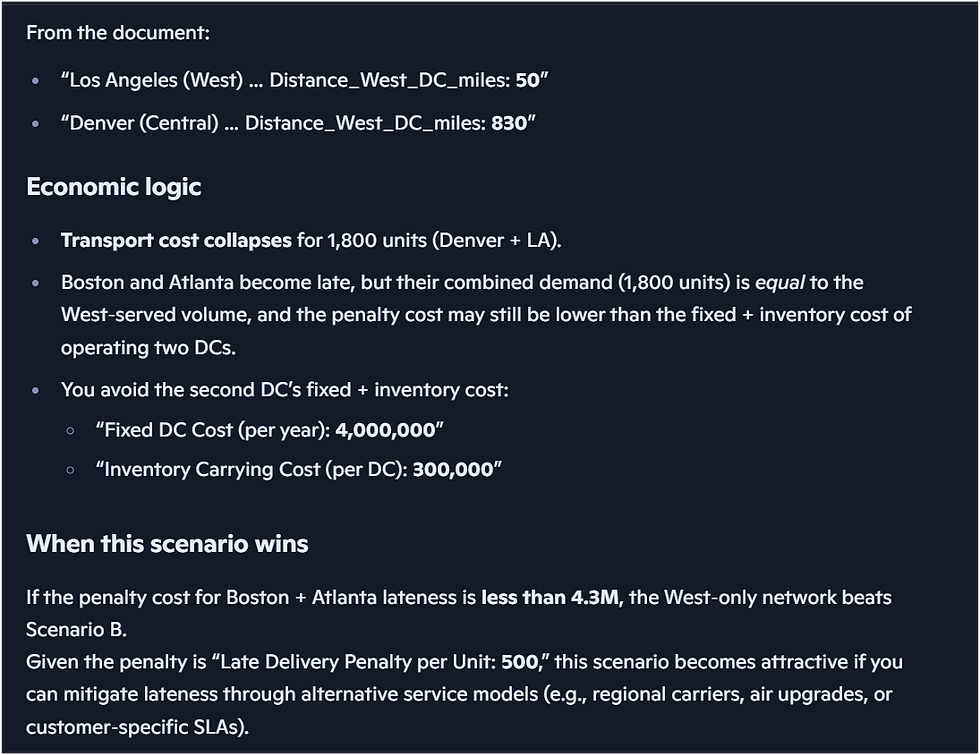
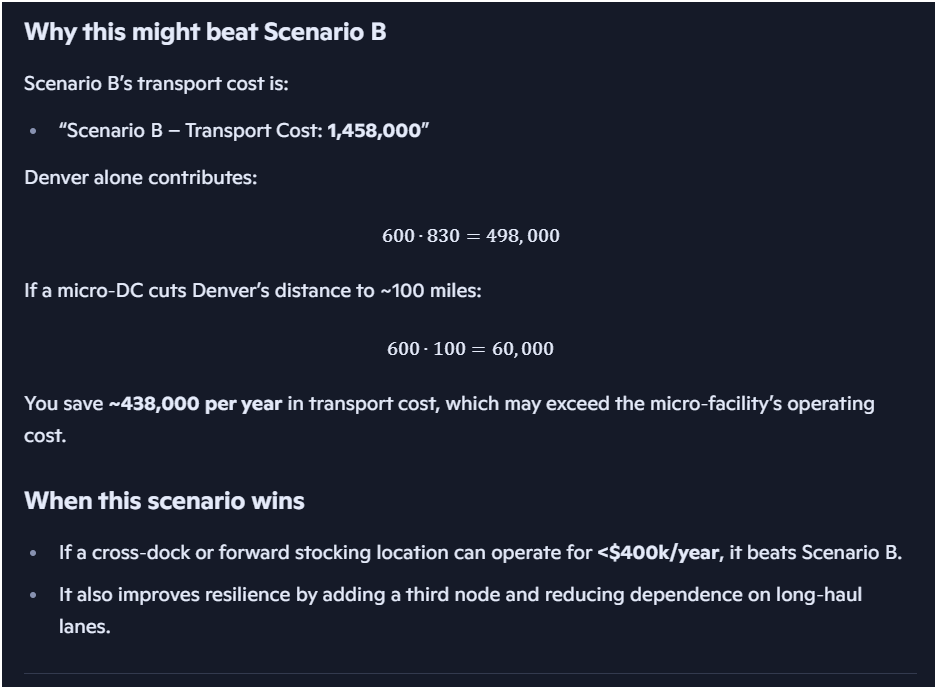
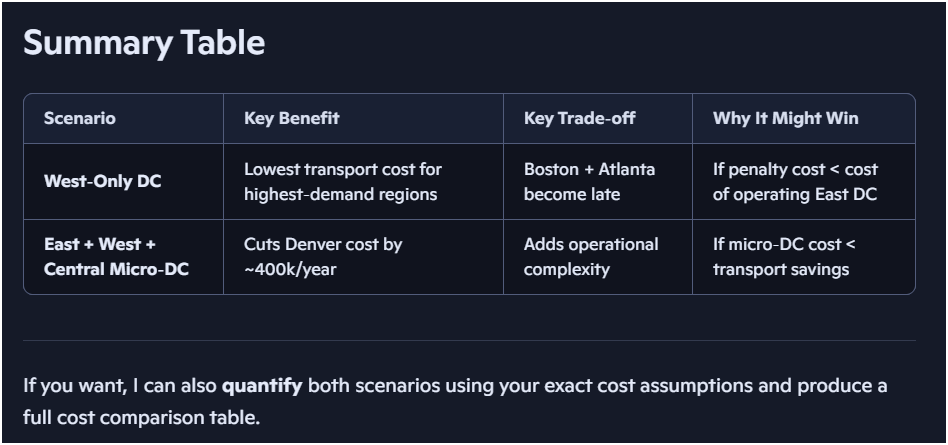
Step 7b: Potential Higher-Value Network Configurations
Upload the data and ask Copilot:
"Based on this data, suggest 2 additional network scenarios that might outperform both options."

What AI Changed
AI didn’t replace Excel, it changed the way you think.
Without AI, you tested two scenarios and focused on getting the math right. With AI, you explored a wide range of possibilities, understood why outcomes occurred, and shifted your attention from calculation to decision quality.
AI accelerated insight, reduced cognitive load, and expanded your strategic thinking. It turned a spreadsheet exercise into a genuine exploration of trade‑offs — the real heart of network design.
The key takeaway: Excel calculates outcomes. AI helps you ask expert‑level questions and make better decisions.
This is why modern supply chain tools embed AI and optimization engines. AI transforms “what‑if analysis” from hours into minutes, and turns analysts into strategists.


